

Overview
Control Plane can collect custom metrics from your workload by having your application emit a Prometheus formatted list of metrics at a path and port of your choosing. The port can be different than the one serving traffic. Each container in a workload can be configured with metrics. Sample output from the metrics endpoint:cpln_ will be ignored by the scrapping process.
The collected metrics can be viewed by clicking the Metrics link on the workload page within the console. Clear any existing query and enter the name of the metric. Click Run Query to execute.
The time-series displayed will include these labels:
orggvclocationproviderregioncluster_idreplica
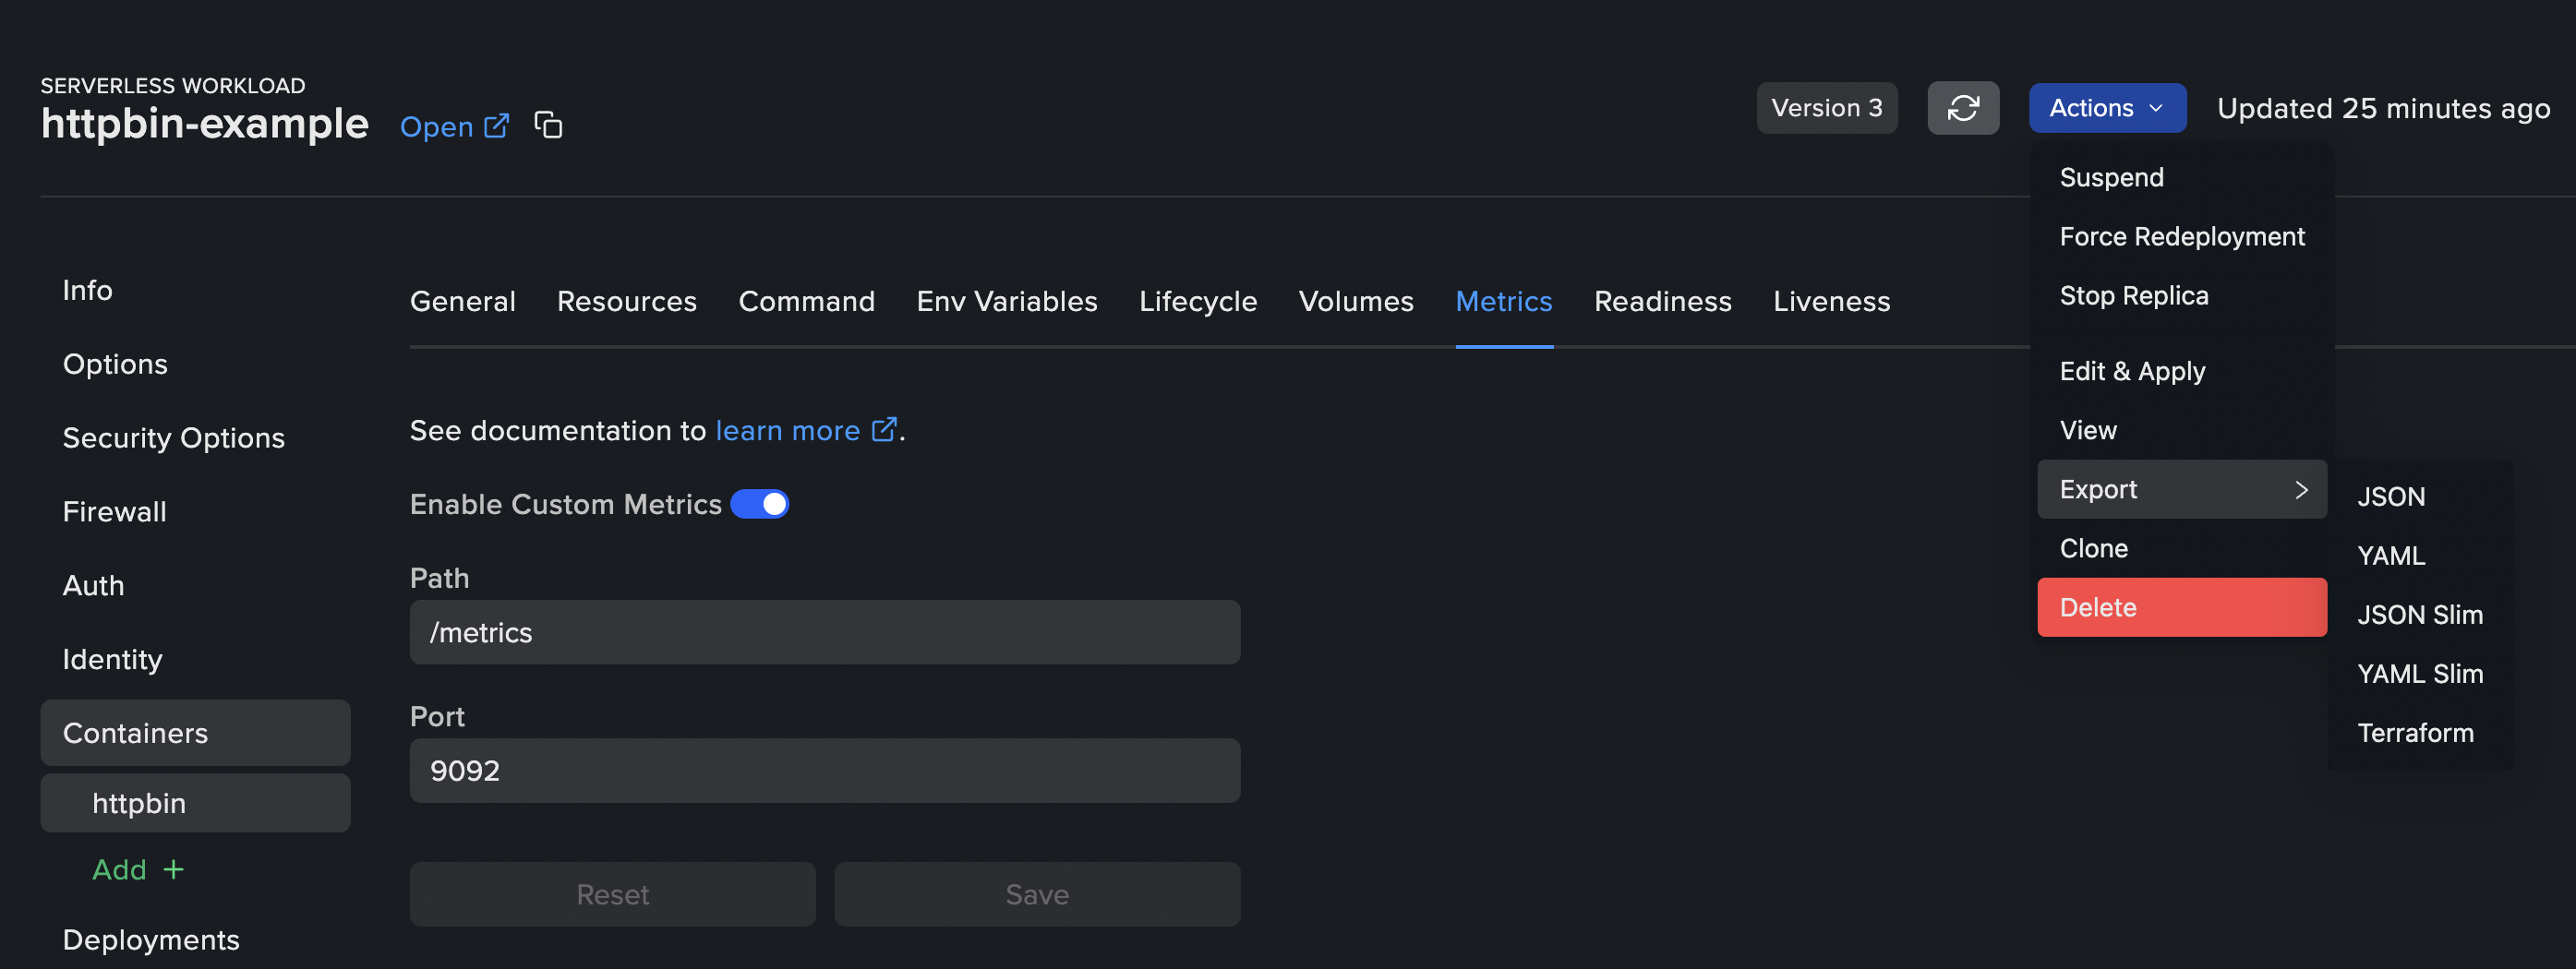
Configuring Custom Metrics Scraping
- In the UI, navigate to
Workloadsin the selected GVC and select the workload for which you want to scrape metrics. - Select the appropriate container name under
Containers, then chooseMetrics. - Configure the
PathandPortwhere the container serves metrics, then save the settings. - The workload will automatically redeploy to apply the changes. Metrics will be collected once the rollout is complete.
API Reference in the documentation, under the Workload section.For Terraform documentation, see the Workload metrics Terraform resource documentation. To create dashboards for collected custom metrics, please refer to the Grafana documentation.
Filter metrics
If you wish to filter which metrics are collected from your workload, you can specify regex patterns in thedropMetrics field.
YAML