Overview
The Logs add-on, once enabled, will send logs from pods running on the cluster, and optionally, Kubernetes audit records, to Control Plane. This will allow you to query the logs and audit records from your clusters managed by the Control Plane centrally in the web UI or in Grafana.Supported Providers
How to Enable
The Logs add-on can be enabled for your Kubernetes cluster either during the cluster creation process or at any time thereafter. The following sections outline the methods for enabling the add-on:At Cluster Creation
-
Through Cluster Manifest: Add the following snippet to your cluster manifest when creating the cluster:
YAML
-
Using the Console: If you’re creating the cluster through the console, navigate to
Add-ons, find theLogsadd-on in the list of available add-ons, and toggle it on.
After Cluster Creation
If the Logs add-on was not enabled during the cluster creation, you can still enable it using either of the following methods:Using Manifest
Underspec.addOns in the YAML manifest of the cluster, you can edit it either by navigating to the cluster in the Console and using the Edit & Apply option for the cluster, or by applying the entire manifest using the cpln apply >_ option in the upper right corner or by using the cpln CLI.
Add the following:
YAML
Using UI
- Navigate to Control Plane Console: Visit the Control Plane Console.
- Navigate to the Kubernetes cluster: In the Control Plane Console, navigate to
Kubernetesin the left sidebar panel and click on the Kubernetes cluster for which you want to enable logging. - Enable Logs: Choose
Add-onsand locate theLogsadd-on from the list of available add-ons, then toggle it on.
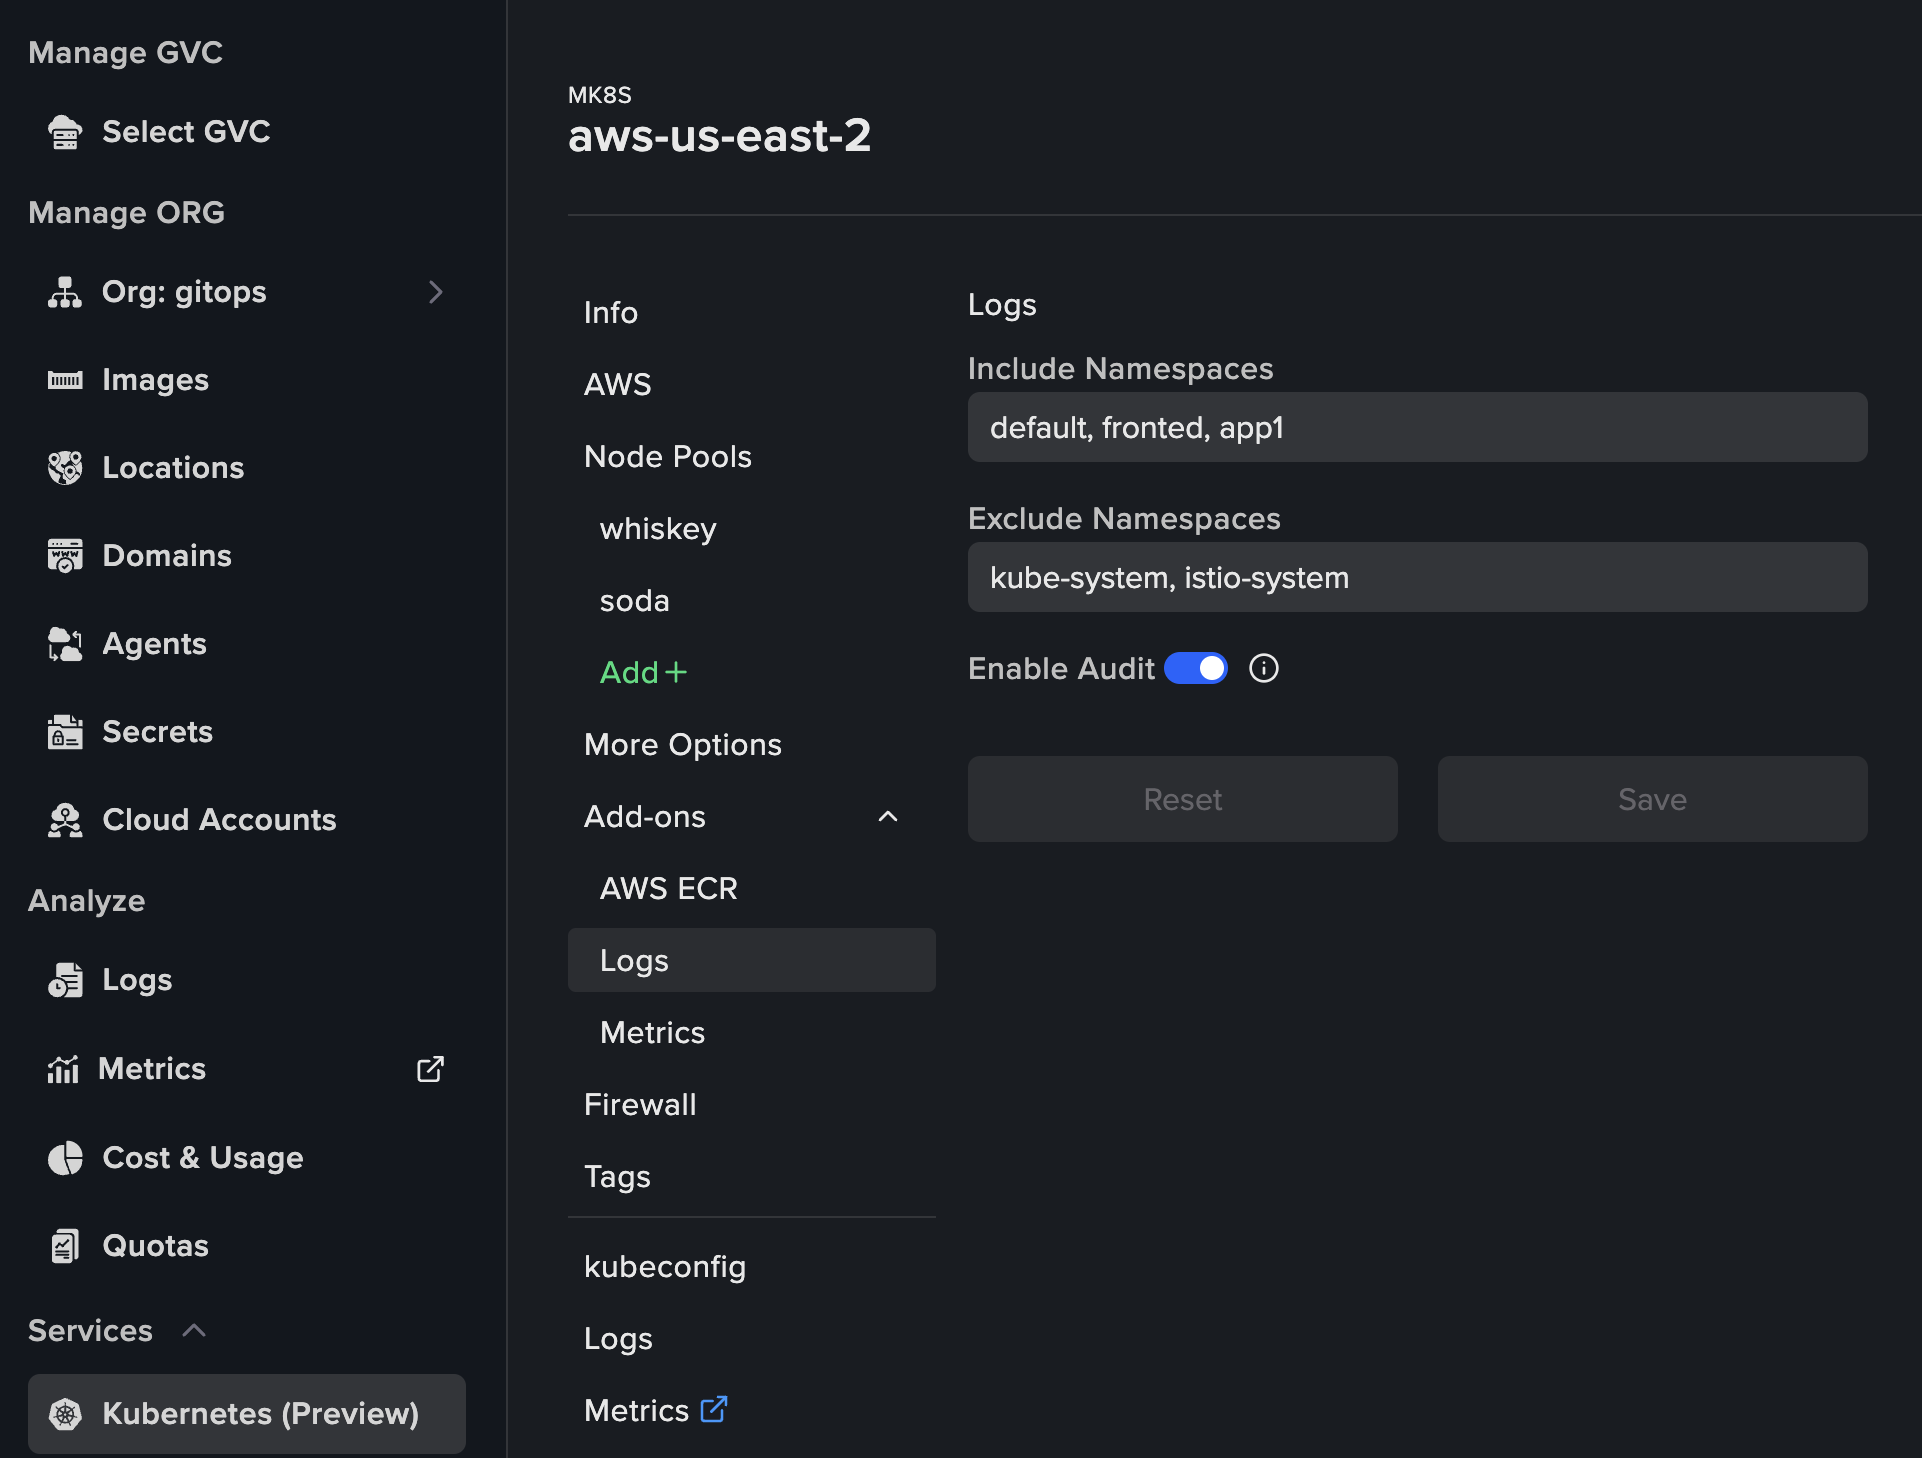
Configuring Logs add-on
The configuration is optional. You can configure the following:- List of namespaces to include for logging collection
- List of namespaces to exclude for logging collection
- Enable/Disable audit
YAML
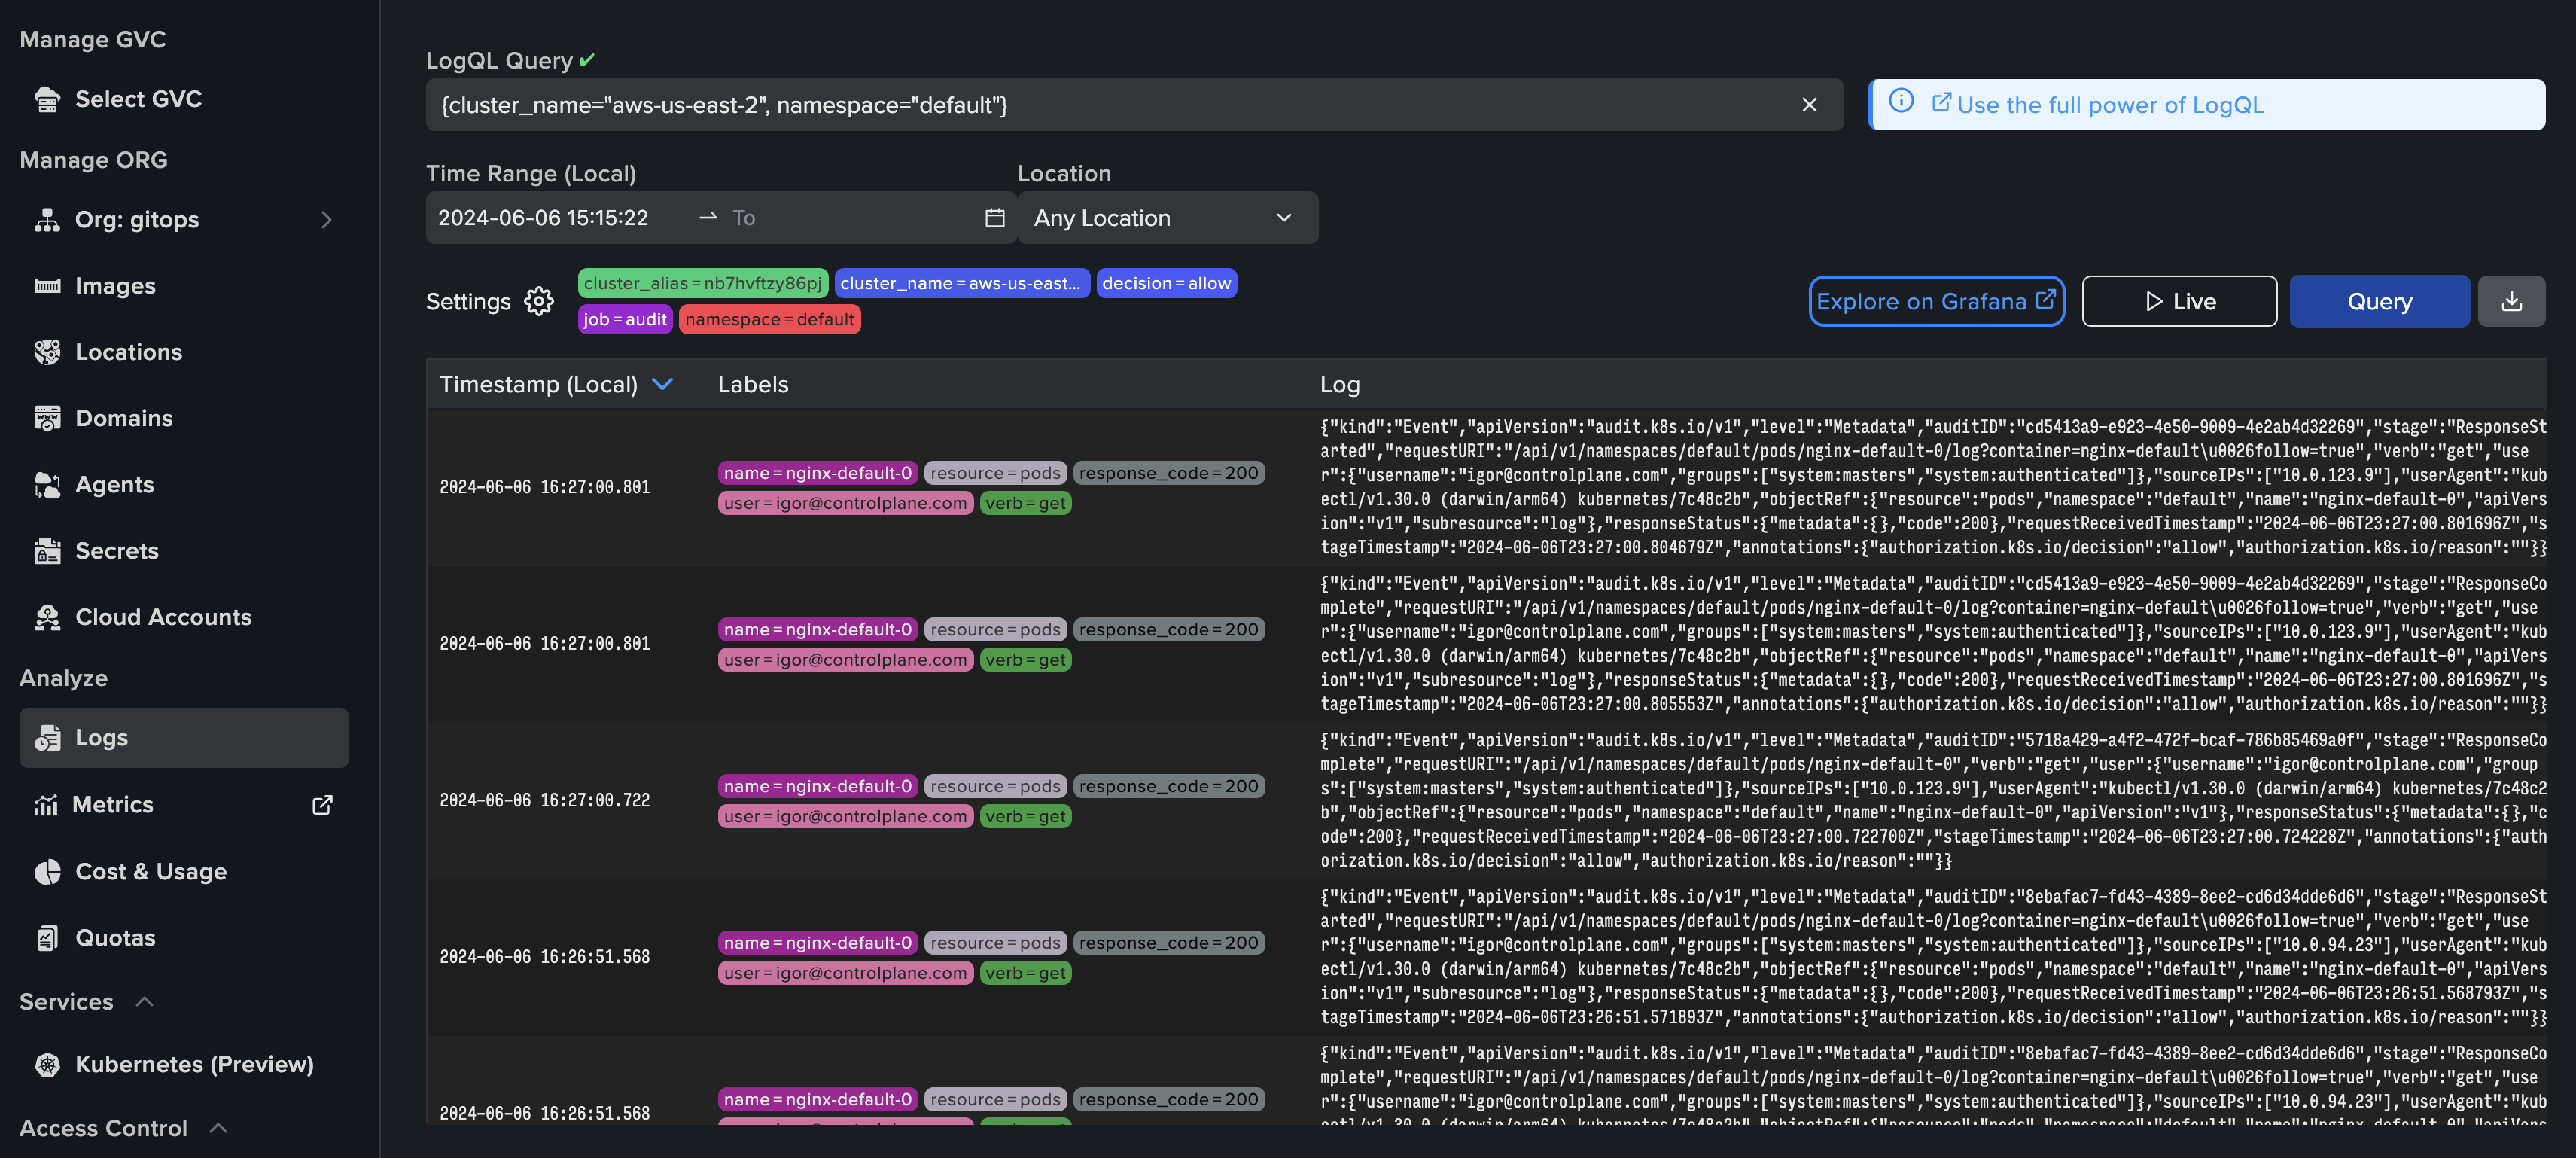
Analyzing Logs
Once enabled, you can analyze the logs and audit events. For LogQL query examples and Grafana integration, see the Logs documentation.- Navigate to Control Plane Console: Visit the Control Plane Console.
- Analyze logs: In the Control Plane Console, navigate to
Logsin the left sidebar panel.
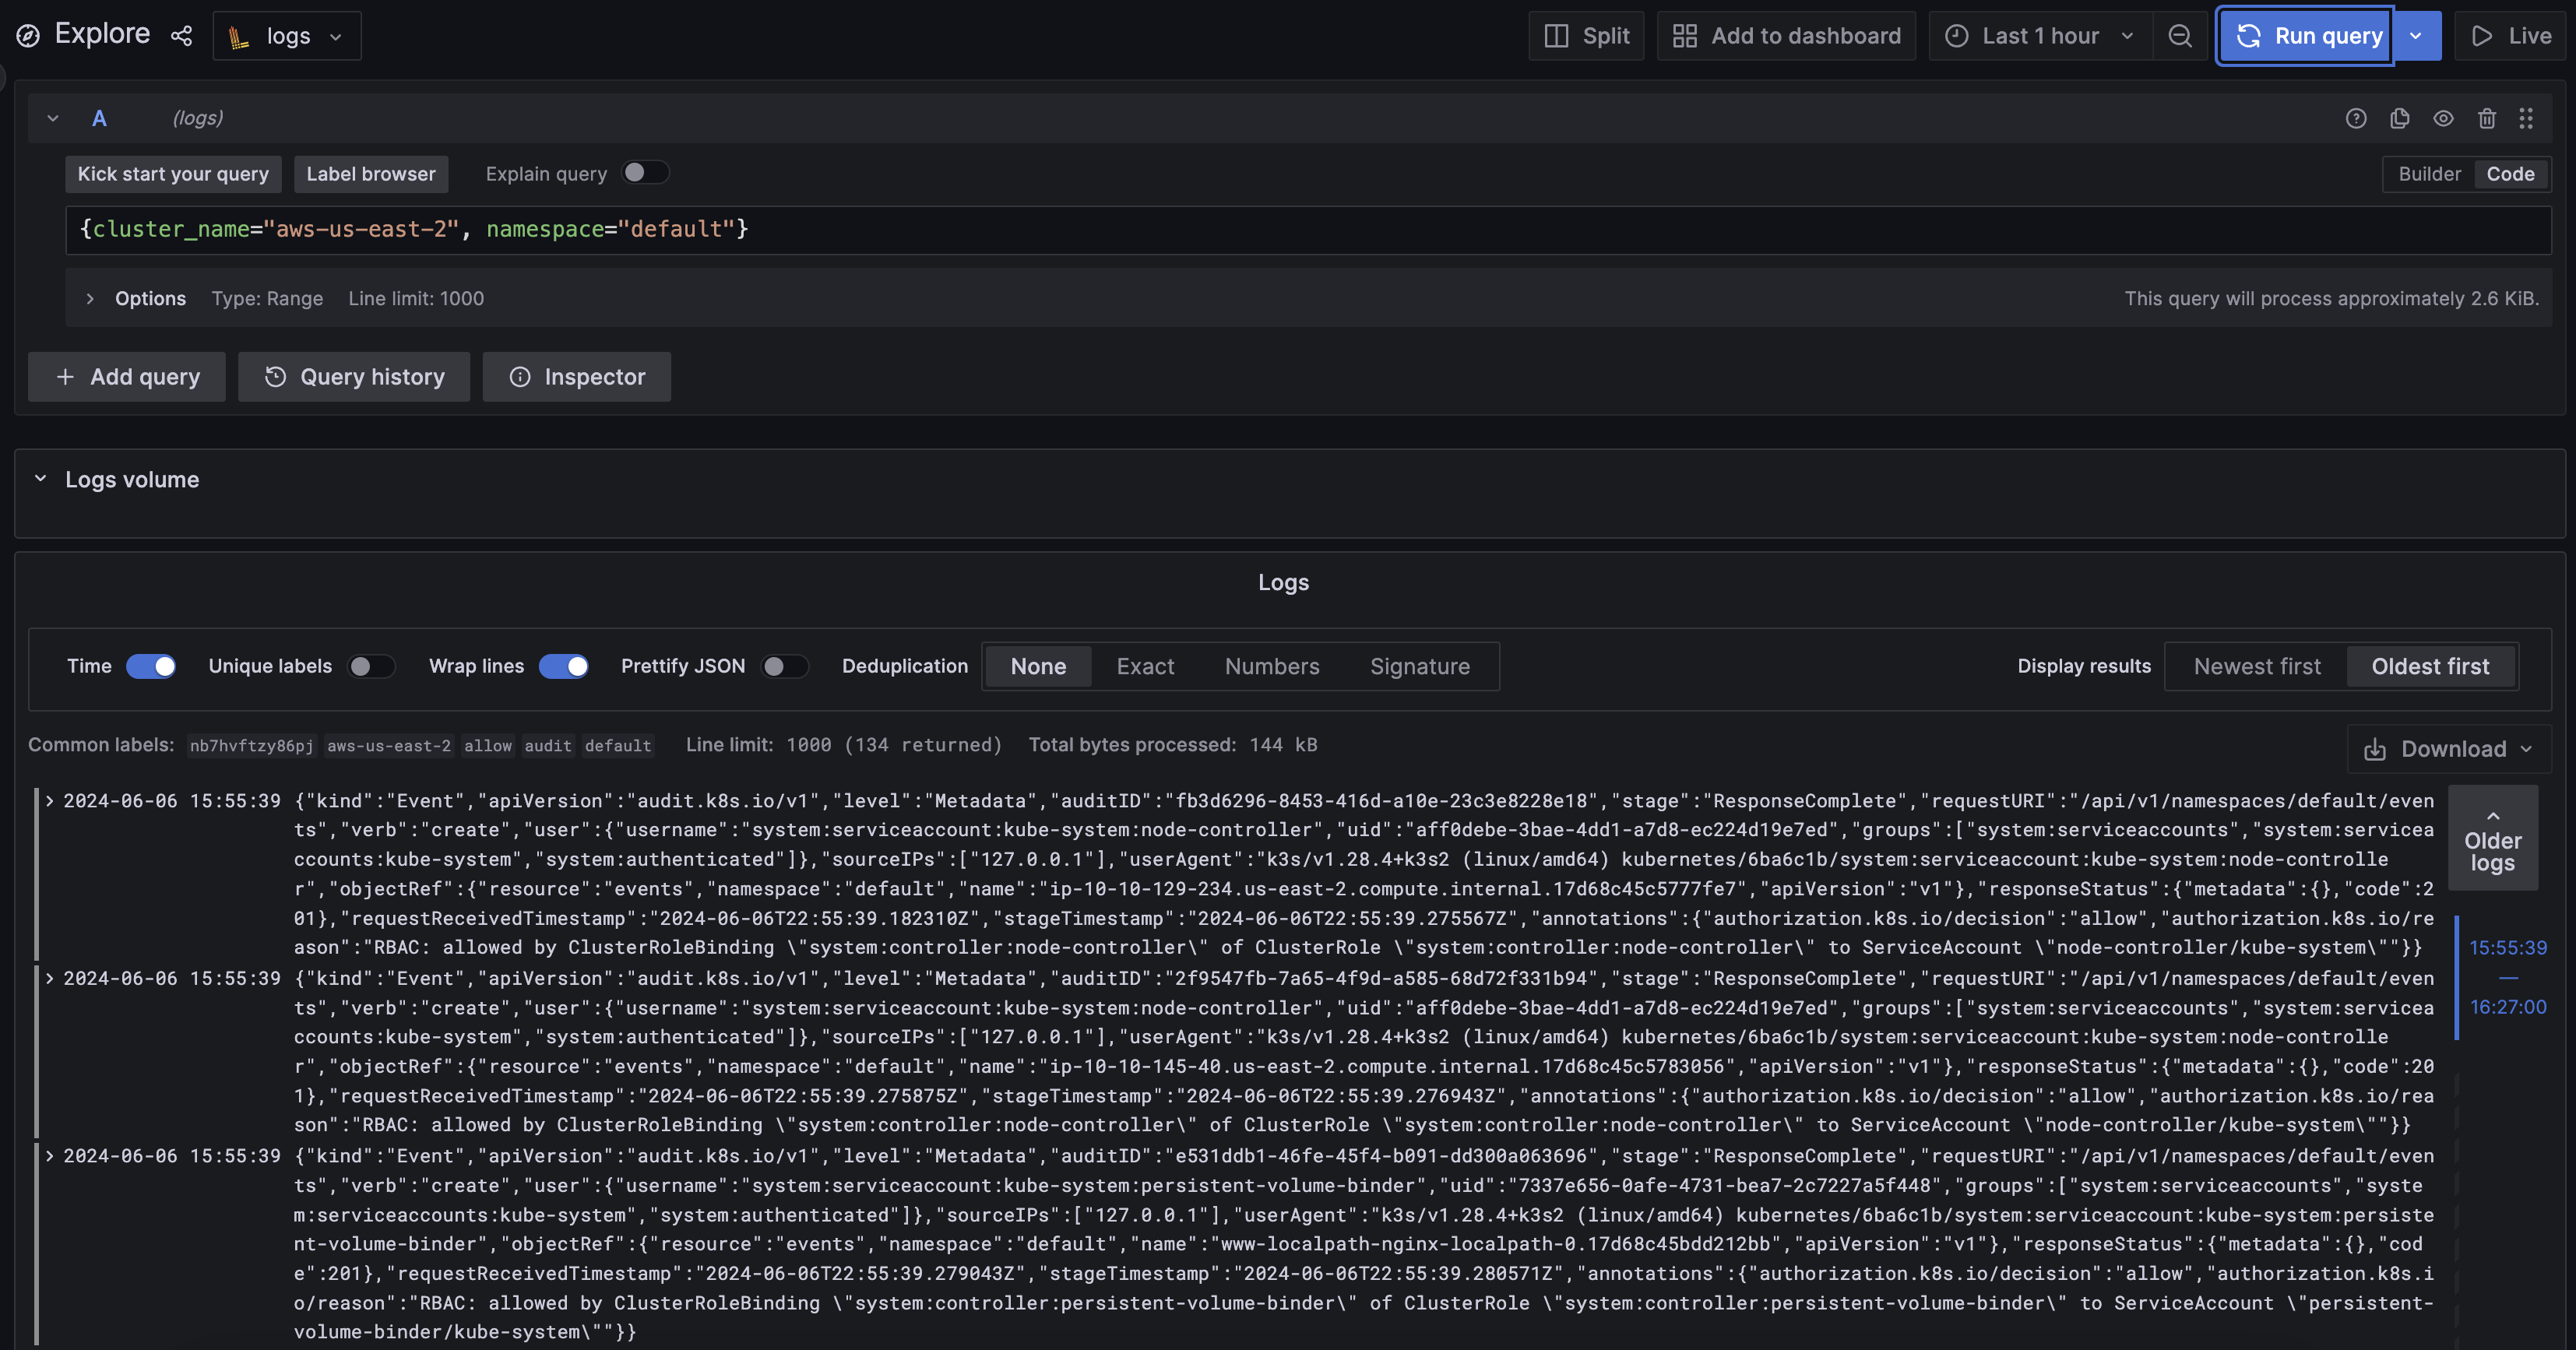
Use LogQL for query. Example query:{cluster_name="aws-us-east-2", namespace="default"}
Explore On Grafana and analyze logs in Grafana: