> ## Documentation Index
> Fetch the complete documentation index at: https://docs.controlplane.com/llms.txt
> Use this file to discover all available pages before exploring further.
# Custom Metrics
> Collect Prometheus-formatted custom metrics from workload containers and use them for autoscaling and monitoring.
## Overview
Control Plane can collect custom metrics from your workload by having your application emit a [Prometheus formatted list of metrics](https://prometheus.io/docs/practices/naming/) at a path and port of your choosing. The port can be different than the one serving traffic. Each container in a workload can be configured with metrics.
The convention is to use the path `/metrics`, but any path can be used.
Sample output from the metrics endpoint:
```text theme={null}
MY_COUNTER 788
MY_COUNTER_2 123
NUM_USERS 2
NUM_ORDERS 91
```
The platform will scrape all the replicas in the workload every 30 seconds with a 5 second timeout. Metric names with the prefix `cpln_` will be ignored by the scrapping process.
The collected metrics can be viewed by clicking the `Metrics` link on the workload page within the console. Clear any existing query and enter the name of the metric. Click `Run Query` to execute.
The time-series displayed will include these labels:
* `org`
* `gvc`
* `location`
* `provider`
* `region`
* `cluster_id`
* `replica`
## Configuring Custom Metrics Scraping
1. In the UI, navigate to `Workloads` in the selected [GVC](/reference/gvc) and select the workload for which you want to scrape metrics.
2. Select the appropriate container name under `Containers`, then choose `Metrics`.
3. Configure the `Path` and `Port` where the container serves metrics, then save the settings.
4. The workload will automatically redeploy to apply the changes. Metrics will be collected once the rollout is complete.
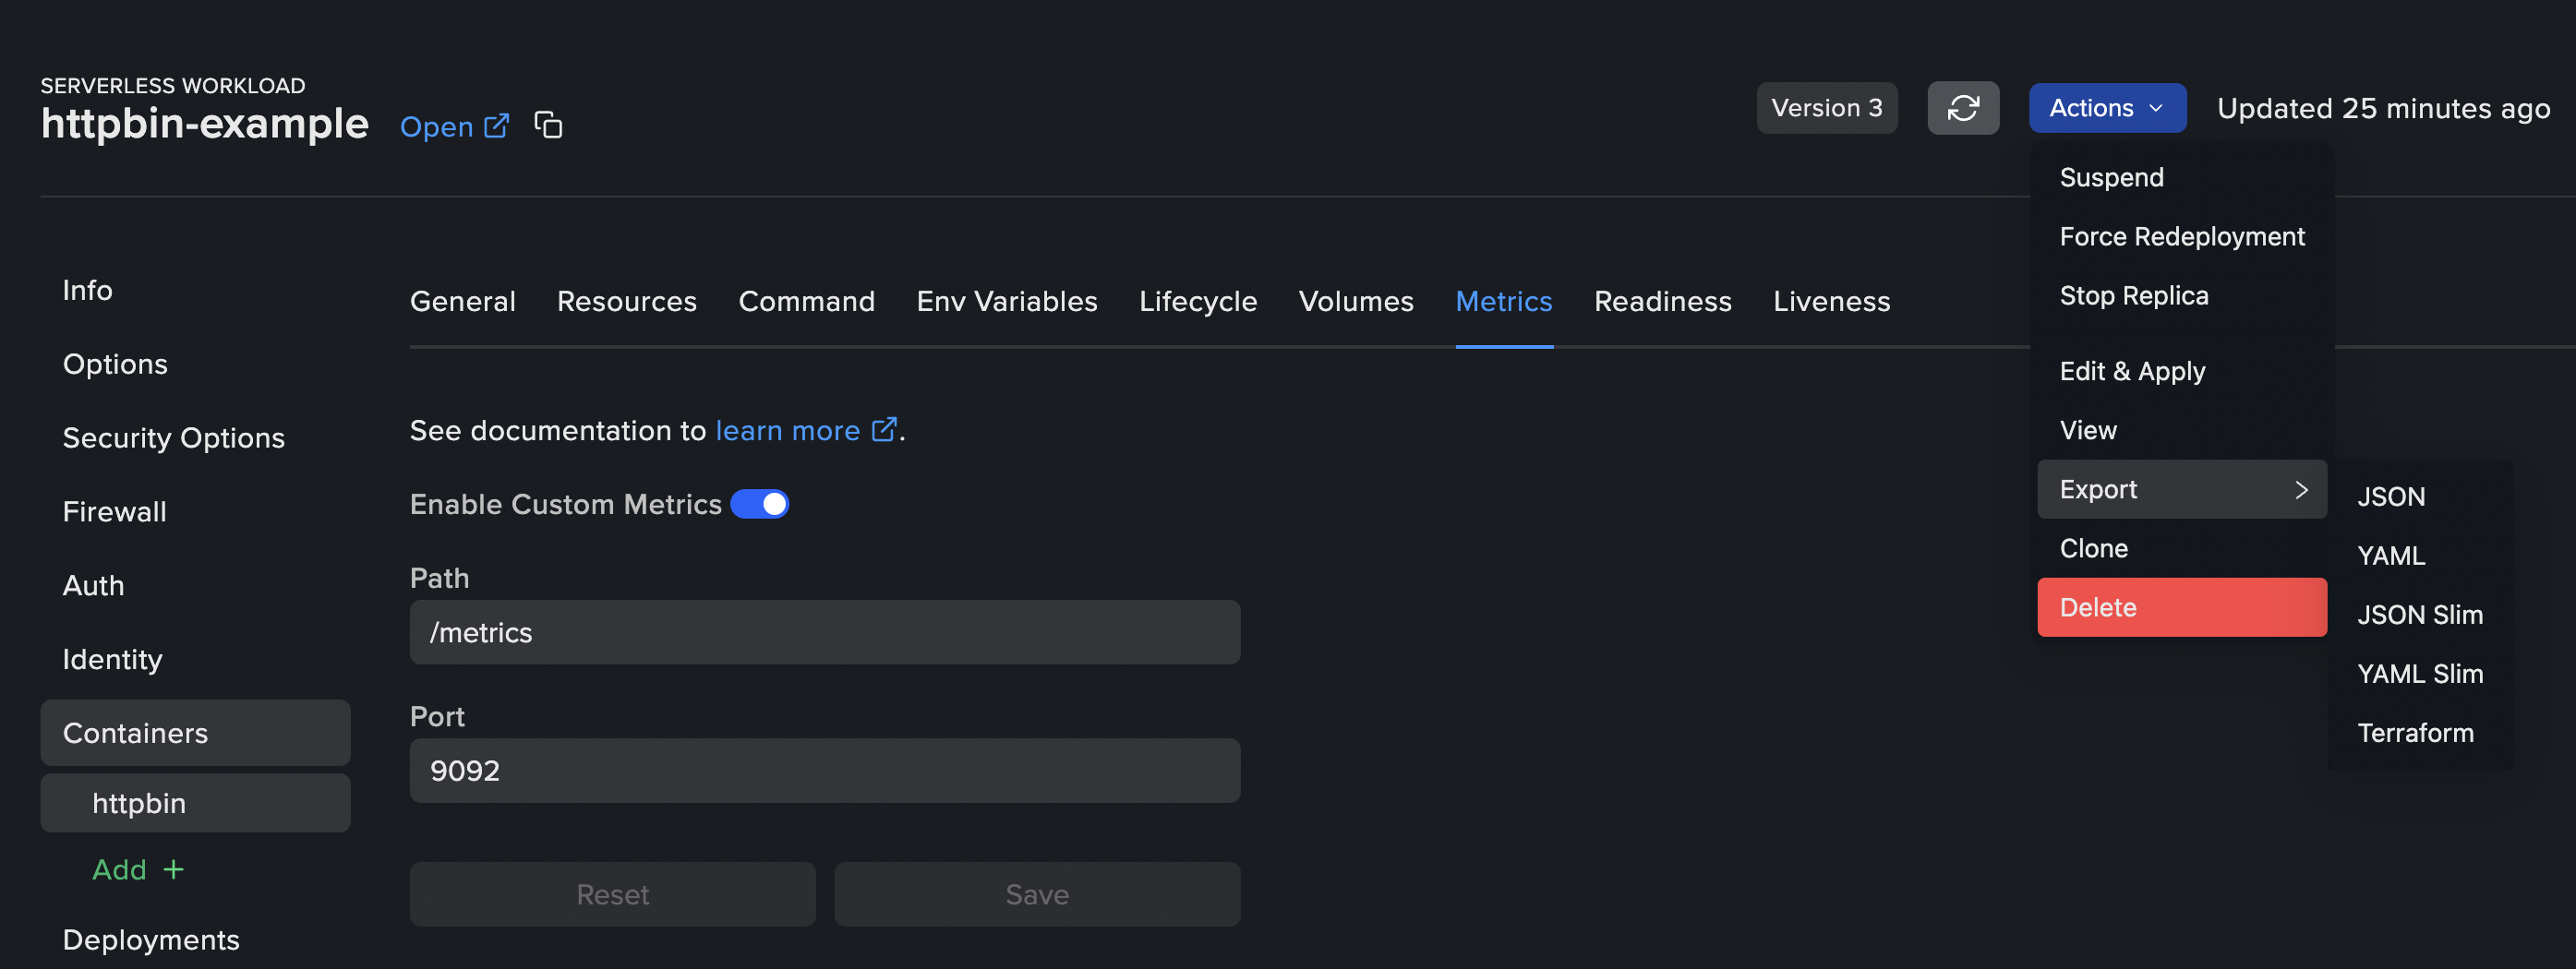 All objects in the UI can be exported to YAML, JSON, or Terraform formats by clicking `Actions` and selecting `Export`.
For the configuration schema to use with the API, please refer to the `API Reference` in the documentation, under the `Workload` section.\
For Terraform documentation, see the [Workload metrics Terraform resource documentation](https://registry.terraform.io/providers/controlplane-com/cpln/latest/docs/resources/workload#nestedblock--container--metrics).
To create dashboards for collected custom metrics, please refer to the [Grafana documentation](https://grafana.com/docs/grafana/latest/dashboards/build-dashboards/).
## Filter metrics
If you wish to filter which metrics are collected from your workload, you can specify regex patterns in the `dropMetrics` field.
```yaml YAML theme={null}
kind: workload
spec:
containers:
- name: my-container
metrics:
path: /metrics
port: 9090
dropMetrics:
- '^go_.*' # Drop all go runtime metrics
- '^process_.*' # Drop all process metrics
- 'MY_UNWANTED_METRIC' # Drop a specific metric
```
All objects in the UI can be exported to YAML, JSON, or Terraform formats by clicking `Actions` and selecting `Export`.
For the configuration schema to use with the API, please refer to the `API Reference` in the documentation, under the `Workload` section.\
For Terraform documentation, see the [Workload metrics Terraform resource documentation](https://registry.terraform.io/providers/controlplane-com/cpln/latest/docs/resources/workload#nestedblock--container--metrics).
To create dashboards for collected custom metrics, please refer to the [Grafana documentation](https://grafana.com/docs/grafana/latest/dashboards/build-dashboards/).
## Filter metrics
If you wish to filter which metrics are collected from your workload, you can specify regex patterns in the `dropMetrics` field.
```yaml YAML theme={null}
kind: workload
spec:
containers:
- name: my-container
metrics:
path: /metrics
port: 9090
dropMetrics:
- '^go_.*' # Drop all go runtime metrics
- '^process_.*' # Drop all process metrics
- 'MY_UNWANTED_METRIC' # Drop a specific metric
```