> ## Documentation Index
> Fetch the complete documentation index at: https://docs.controlplane.com/llms.txt
> Use this file to discover all available pages before exploring further.
# Logs
> Query and visualize workload logs using LogQL across all cloud providers and regions. Includes Grafana integration, live streaming, and 30-day retention.
## Overview
The logs UI displays the logs for your running [workloads](/concepts/workload). No matter which combination of cloud providers or regions your workload is running at, the logs will be aggregated and displayed as if they were running at one provider/region.
[Filters](#log-filters) can be applied to pinpoint any issues that might be occurring at a specific [workload](/concepts/workload).
The [Grafana](https://grafana.com/grafana/) explorer is available to query and visualize your log data.
## LogQL
The Control Plane logs use the LogQL query language to query your log data.
The documentation for LogQL is available in the [LogQL documentation](https://grafana.com/docs/loki/latest/logql/).
The available labels that can be used to create a query are:
* container
* gvc
* location
* replica
* stream
* workload
## Log Filters
The results of a query can be filtered by the following:
* [Location](/reference/location)
* [Container](/reference/workload/containers)
* Start date and optional end date (the date/time selector includes helper buttons ranging from the `Last 5 minutes` to the `Last 30 days`)
Selecting a [location](/reference/location) or [container](/reference/workload/containers) will automatically add the value to the LogQL query.
## Live Logs
The results of the given query can be streamed in real-time using the `Live` button.
After entering the desired query, click the `Live` button.
To end the live streaming, click the `Stop` button.
## Grafana
Clicking on the `Explore on Grafana` link will launch the Grafana UI in a new tab. When clicking the button from a specific [workload](/concepts/workload), the query will be prefilled with the [GVC](/reference/gvc) and [workload](/concepts/workload).
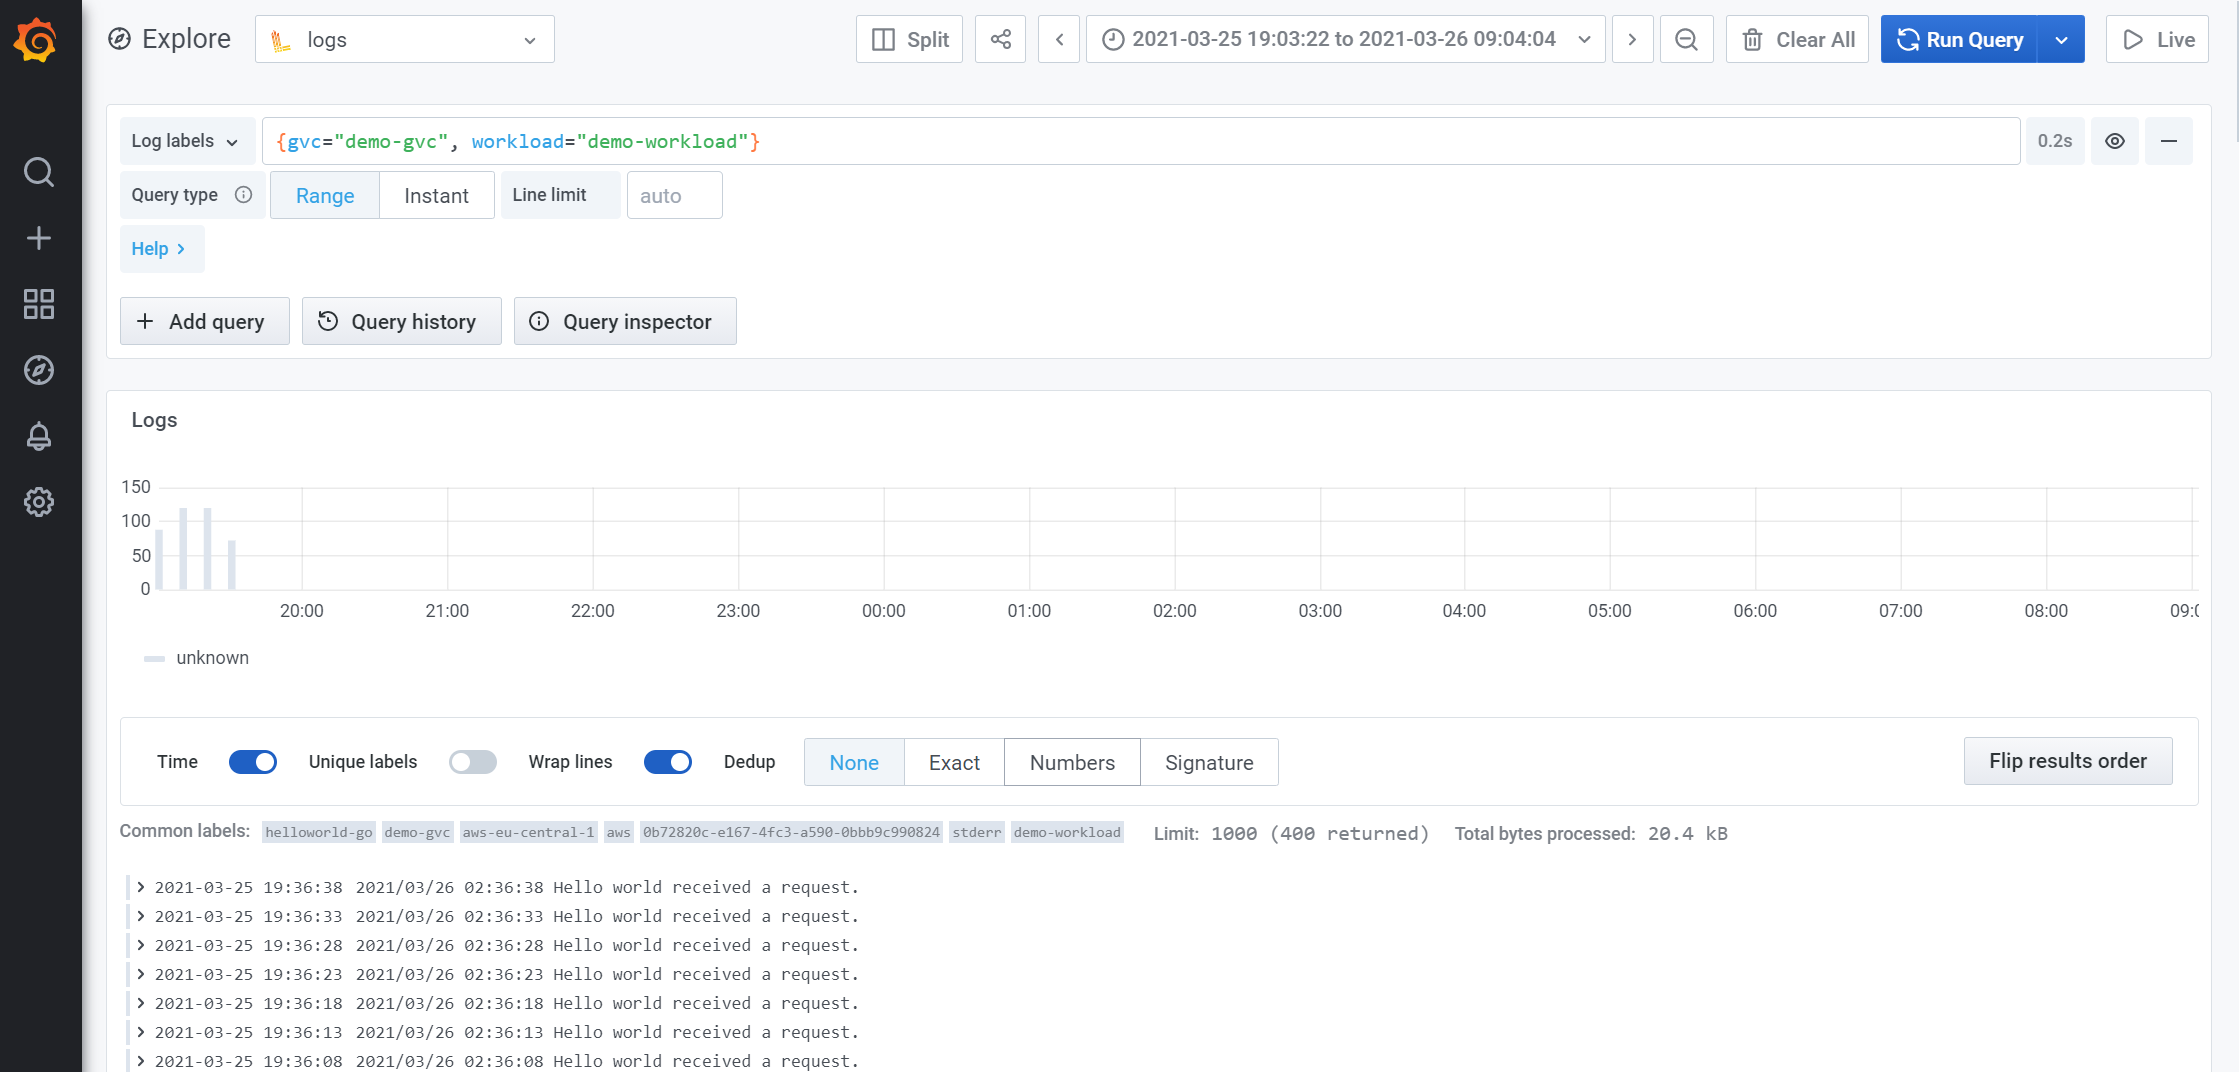
Grafana gives you the ability to "Explore your data through ad-hoc queries and dynamic drill-down. Split view and compare different time ranges, queries, and data sources side by side."
View the [Grafana Explore documentation](https://grafana.com/docs/grafana/latest/explore/).
Below is a sample of the Grafana UI after executing a query:
 ## Example LogQL Queries
* View the logs for a specific [GVC](/reference/gvc) and [workload](/concepts/workload)
```log Query theme={null}
{gvc="GVC_NAME", workload="WORKLOAD_NAME"}
```
* Access logs with error
```log Query theme={null}
{gvc="GVC_NAME", workload="WORKLOAD_NAME", container="_accesslog"} |= "\" 50"
```
* Graph of access logs with error by replica
```log Query theme={null}
sum(count_over_time({gvc="GVC_NAME", workload="WORKLOAD_NAME", container="_accesslog"} |= "\" 50"[1m])) by (replica)
```
* Graph of access logs with error by workload
```log Query theme={null}
sum(count_over_time({gvc="GVC_NAME", container="_accesslog"} |= "\" 50"[1m])) by (workload)
```
* View the logs for a GVC, workload, location, and container
```log Query theme={null}
{gvc="GVC_NAME", workload="WORKLOAD_NAME", location="aws-eu-central-1", container="CONTAINER_NAME"}
```
* View all logs (will contain all workloads logs across all gvcs)
```log Query theme={null}
{gvc=~".+"}
```
* Count of inbound requests by ip
This query will produce a count of inbound requests by source ip address for the last 10 minutes.
You must set the grafana query options to type `Instant` so that a list is produced and can be sorted.
```log Query theme={null}
sum(count_over_time({gvc="GVC_NAME", workload="WORKLOAD_NAME", container="_accesslog"} | logfmt | regexp "(?P\\d+\\.\\d+\\.\\d+\\.\\d+)"[10m])) by (ip)
```
* Count of inbound requests by path
This query will produce a count of inbound requests by request path for the last 10 minutes with a latency greater than 100ms.
You must set the grafana query options to type `Instant` so that a list is produced and can be sorted.
```log Query theme={null}
sum(count_over_time({gvc="GVC_NAME", workload="WORKLOAD_NAME", container="_accesslog"} | logfmt | regexp "(?P\\/[^\"]*\\s).+\\d+ \\d+ \\d+ (?P\\d+) " | latency > 100 [10m])) by (workload, path)
```
## Log Retention Policy
The log retention period for logs stored at Control Plane is 30 days by default and can be adjusted for each Org.
Learn how to [configure log shipping to an external provider](/external-logging/overview).
## CLI
To view the CLI documentation for logs, see the [Logs CLI reference](/cli-reference/commands/logs).
## Example LogQL Queries
* View the logs for a specific [GVC](/reference/gvc) and [workload](/concepts/workload)
```log Query theme={null}
{gvc="GVC_NAME", workload="WORKLOAD_NAME"}
```
* Access logs with error
```log Query theme={null}
{gvc="GVC_NAME", workload="WORKLOAD_NAME", container="_accesslog"} |= "\" 50"
```
* Graph of access logs with error by replica
```log Query theme={null}
sum(count_over_time({gvc="GVC_NAME", workload="WORKLOAD_NAME", container="_accesslog"} |= "\" 50"[1m])) by (replica)
```
* Graph of access logs with error by workload
```log Query theme={null}
sum(count_over_time({gvc="GVC_NAME", container="_accesslog"} |= "\" 50"[1m])) by (workload)
```
* View the logs for a GVC, workload, location, and container
```log Query theme={null}
{gvc="GVC_NAME", workload="WORKLOAD_NAME", location="aws-eu-central-1", container="CONTAINER_NAME"}
```
* View all logs (will contain all workloads logs across all gvcs)
```log Query theme={null}
{gvc=~".+"}
```
* Count of inbound requests by ip
This query will produce a count of inbound requests by source ip address for the last 10 minutes.
You must set the grafana query options to type `Instant` so that a list is produced and can be sorted.
```log Query theme={null}
sum(count_over_time({gvc="GVC_NAME", workload="WORKLOAD_NAME", container="_accesslog"} | logfmt | regexp "(?P\\d+\\.\\d+\\.\\d+\\.\\d+)"[10m])) by (ip)
```
* Count of inbound requests by path
This query will produce a count of inbound requests by request path for the last 10 minutes with a latency greater than 100ms.
You must set the grafana query options to type `Instant` so that a list is produced and can be sorted.
```log Query theme={null}
sum(count_over_time({gvc="GVC_NAME", workload="WORKLOAD_NAME", container="_accesslog"} | logfmt | regexp "(?P\\/[^\"]*\\s).+\\d+ \\d+ \\d+ (?P\\d+) " | latency > 100 [10m])) by (workload, path)
```
## Log Retention Policy
The log retention period for logs stored at Control Plane is 30 days by default and can be adjusted for each Org.
Learn how to [configure log shipping to an external provider](/external-logging/overview).
## CLI
To view the CLI documentation for logs, see the [Logs CLI reference](/cli-reference/commands/logs).